In conjunction with the ggplot2::theme system, the following element_
functions enable images in non-data components of the plot, e.g. axis text.
element_mlb_logo(),element_mlb_scoreboard_logo(),element_mlb_dot_logo(): draws MLB team logos instead of their abbreviationselement_milb_logo,element_milb_light_cap_logo(), andelement_milb_dot_logo: draws MiLB team logos instead of their team nameselement_mlb_dark_cap_logo()andelement_mlb_light_cap_logo(): draws MLB team cap logos instead of their abbreviationselement_mlb_headshot()andelement_milb_dot_headshot(): draws MLB player headshots instead of their MLB IDselement_milb_dot_headshot(): draws MiLB player headshots instead of their MLB IDselement_path(): draws images from valid image URLs instead of the URL.
Usage
element_mlb_logo(
  alpha = NULL,
  colour = NA,
  hjust = NULL,
  vjust = NULL,
  color = NULL,
  size = 0.5
)

element_mlb_scoreboard_logo(
  alpha = NULL,
  colour = NA,
  hjust = NULL,
  vjust = NULL,
  color = NULL,
  size = 0.5
)

element_mlb_dot_logo(
  alpha = NULL,
  colour = NA,
  hjust = NULL,
  vjust = NULL,
  color = NULL,
  size = 0.5
)

element_mlb_dark_cap_logo(
  alpha = NULL,
  colour = NA,
  hjust = NULL,
  vjust = NULL,
  color = NULL,
  size = 0.5
)

element_mlb_light_cap_logo(
  alpha = NULL,
  colour = NA,
  hjust = NULL,
  vjust = NULL,
  color = NULL,
  size = 0.5
)

element_mlb_headshot(
  alpha = NULL,
  colour = NA,
  hjust = NULL,
  vjust = NULL,
  color = NULL,
  size = 0.5
)

element_mlb_dot_headshot(
  alpha = NULL,
  colour = NA,
  hjust = NULL,
  vjust = NULL,
  color = NULL,
  size = 0.5
)

element_path(
  alpha = NULL,
  colour = NA,
  hjust = NULL,
  vjust = NULL,
  color = NULL,
  size = 0.5
)

element_milb_logo(
  alpha = NULL,
  colour = NA,
  hjust = NULL,
  vjust = NULL,
  color = NULL,
  size = 0.5
)

element_milb_light_cap_logo(
  alpha = NULL,
  colour = NA,
  hjust = NULL,
  vjust = NULL,
  color = NULL,
  size = 0.5
)

element_milb_dot_logo(
  alpha = NULL,
  colour = NA,
  hjust = NULL,
  vjust = NULL,
  color = NULL,
  size = 0.5
)

element_milb_dot_headshot(
  alpha = NULL,
  colour = NA,
  hjust = NULL,
  vjust = NULL,
  color = NULL,
  size = 0.5
)
Arguments
- alpha
The alpha channel, i.e. transparency level, as a numerical value between 0 and 1.
- colour, color
The image will be colorized with this color. Use the special character
"b/w"to set it to black and white. For more information on valid color names in ggplot2 see https://ggplot2.tidyverse.org/articles/ggplot2-specs.html?q=colour#colour-and-fill.- hjust, vjust
The horizontal and vertical adjustment respectively. Must be a numerical value between 0 and 1.
- size
The output grob size in
cm(!).
Details
The elements translate MLB team abbreviations or MLB player IDs into logo images or headshots, respectively.
See also
geom_mlb_logos(), geom_mlb_headshots(), and geom_from_path()
for more information on valid team abbreviations, player ids, and other
parameters.
Examples
# \donttest{
library(mlbplotR)
library(ggplot2)
team_abbr <- valid_team_names()
# remove league logos from this example
team_abbr <- team_abbr[!team_abbr %in% c("AL", "NL", "MLB")]
df <- data.frame(
random_value = runif(length(team_abbr), 0, 1),
teams = team_abbr
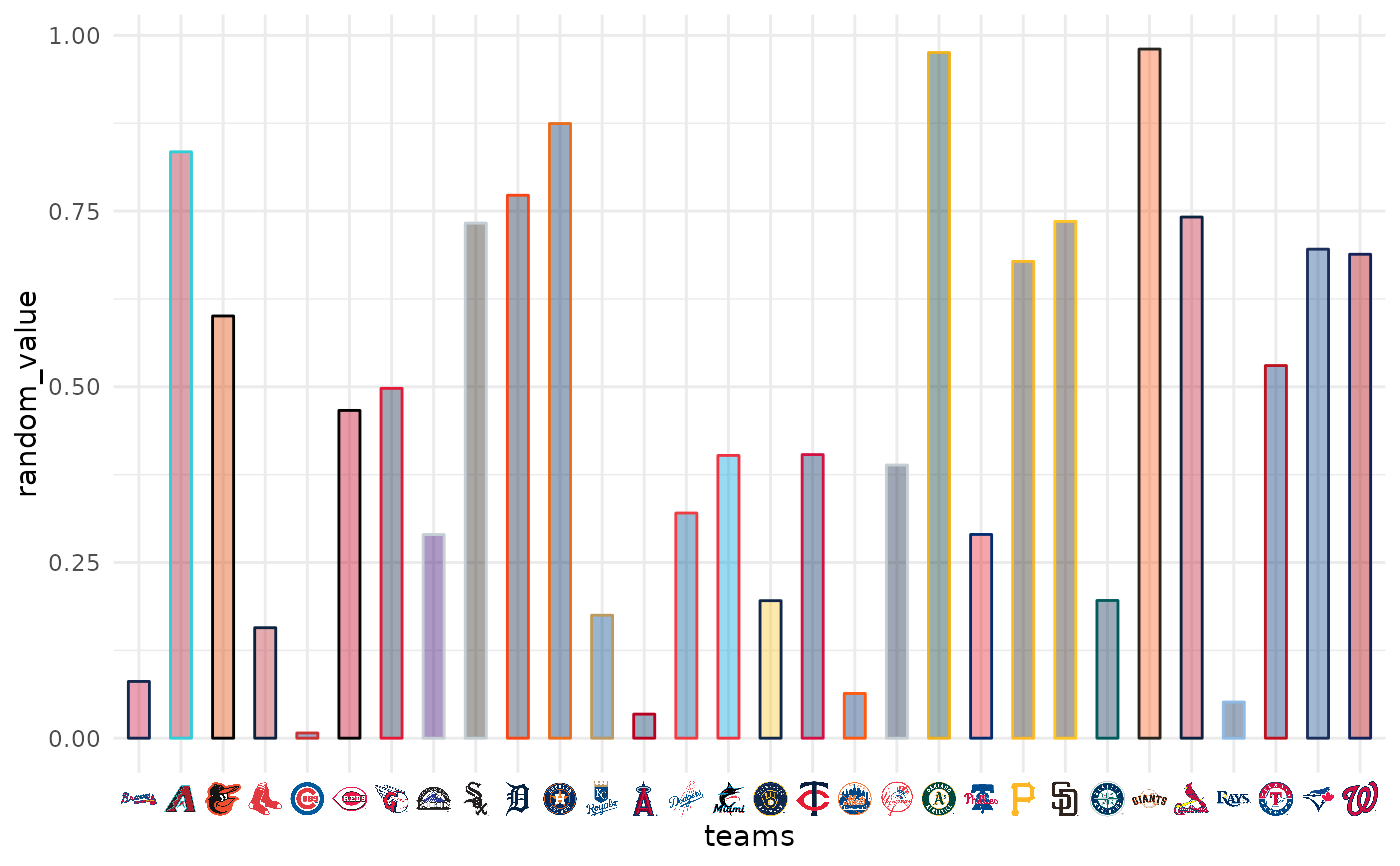
)
# use logos for x-axis
ggplot(df, aes(x = teams, y = random_value)) +
geom_col(aes(color = teams, fill = teams), width = 0.5) +
scale_color_mlb(type = "secondary") +
scale_fill_mlb(alpha = 0.4) +
theme_minimal() +
theme(axis.text.x = element_mlb_logo())
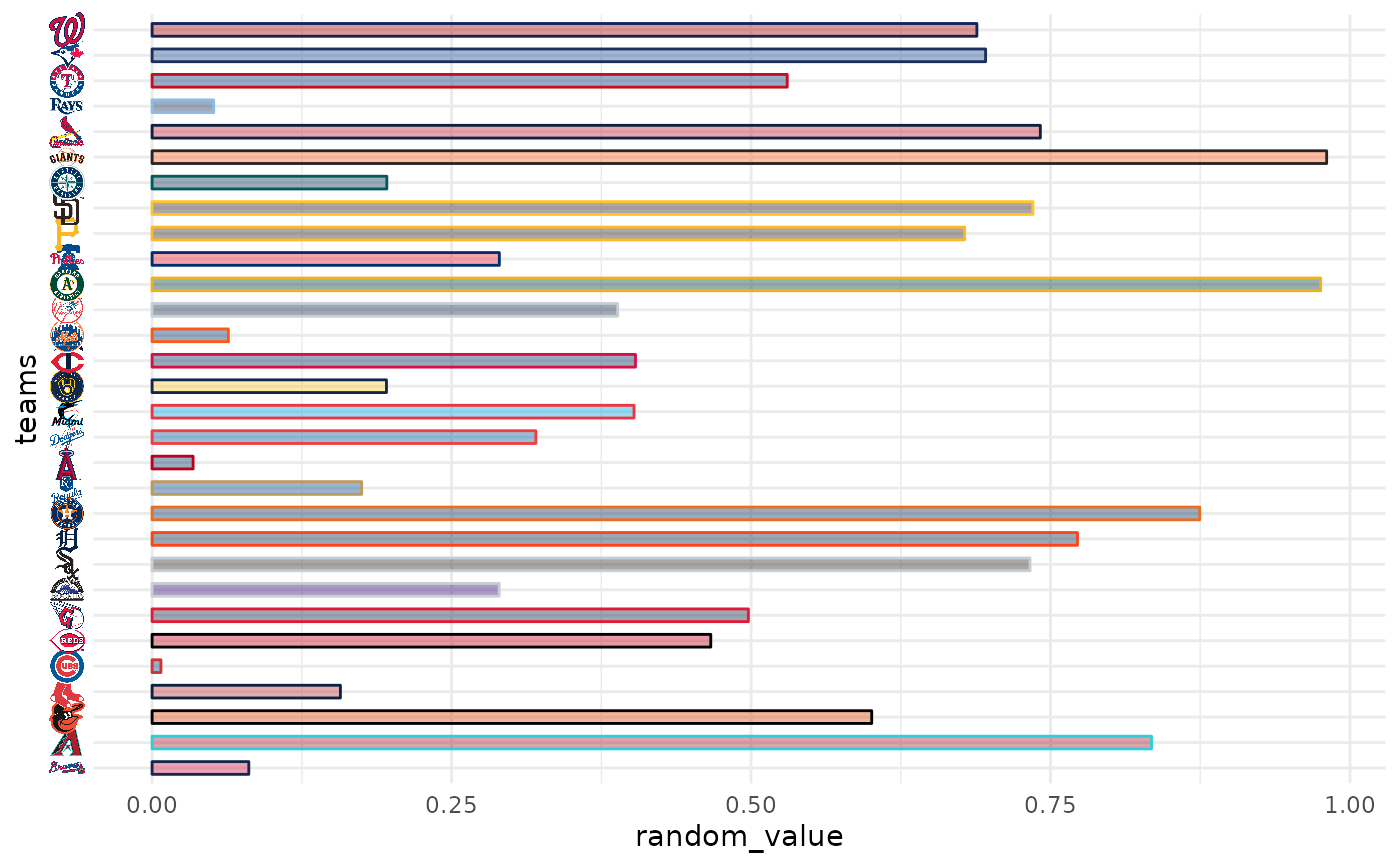
 # use logos for y-axis
ggplot(df, aes(y = teams, x = random_value)) +
geom_col(aes(color = teams, fill = teams), width = 0.5) +
scale_color_mlb(type = "secondary") +
scale_fill_mlb(alpha = 0.4) +
theme_minimal() +
theme(axis.text.y = element_mlb_logo())
 #############################################################################
# Headshot Examples
#############################################################################
library(mlbplotR)
library(ggplot2)
dfh <- data.frame(
random_value = runif(9, 0, 1),
player_id = c("594798",
"592450",
"605141",
"665742",
"545361",
"665487",
"571448",
"0",
"543037")
)
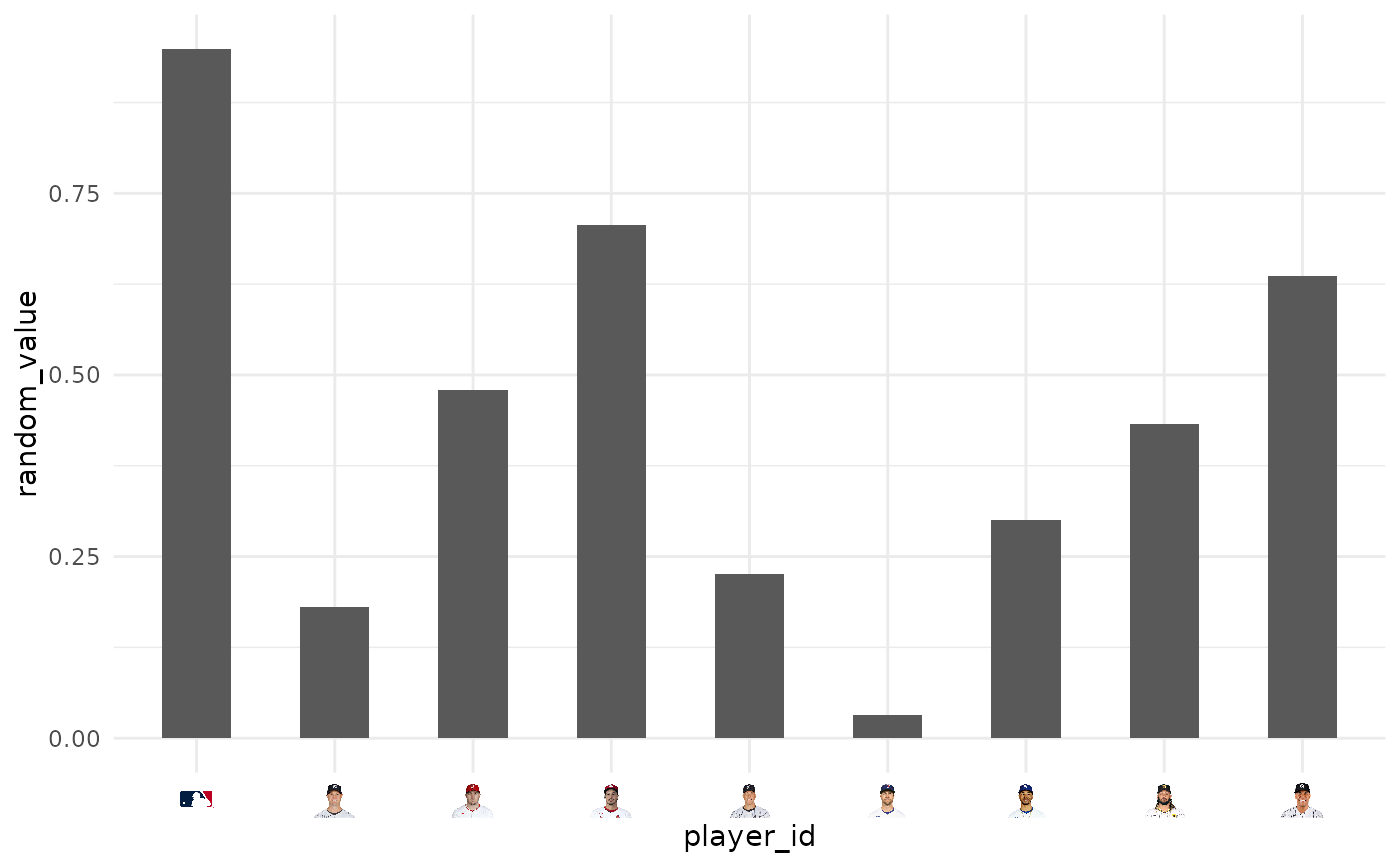
# use headshots for x-axis
ggplot(dfh, aes(x = player_id, y = random_value)) +
geom_col(width = 0.5) +
theme_minimal() +
theme(axis.text.x = element_mlb_headshot())
#############################################################################
# Headshot Examples
#############################################################################
library(mlbplotR)
library(ggplot2)
dfh <- data.frame(
random_value = runif(9, 0, 1),
player_id = c("594798",
"592450",
"605141",
"665742",
"545361",
"665487",
"571448",
"0",
"543037")
)
# use headshots for x-axis
ggplot(dfh, aes(x = player_id, y = random_value)) +
geom_col(width = 0.5) +
theme_minimal() +
theme(axis.text.x = element_mlb_headshot())
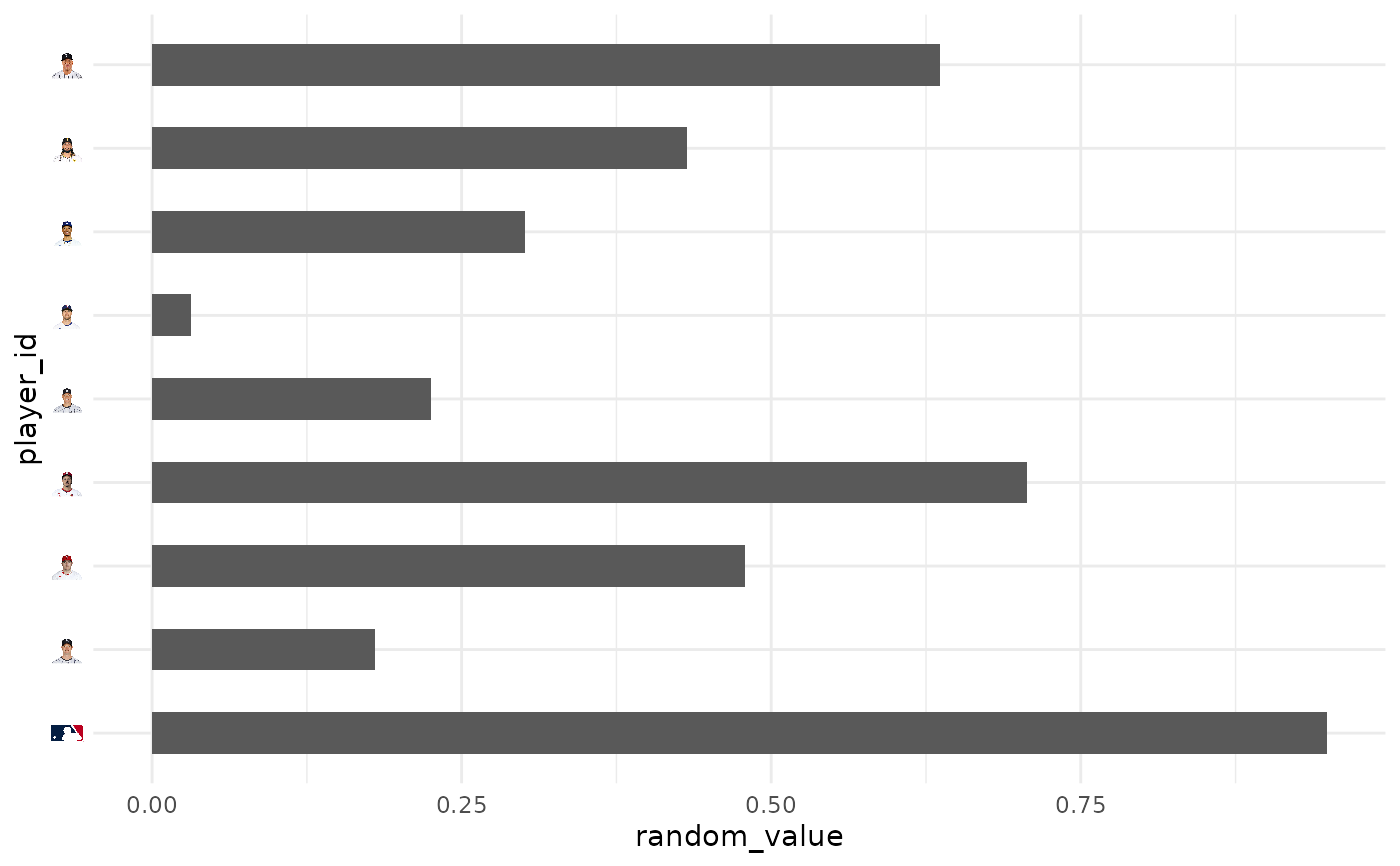
 # use headshots for y-axis
ggplot(dfh, aes(y = player_id, x = random_value)) +
geom_col(width = 0.5) +
theme_minimal() +
theme(axis.text.y = element_mlb_headshot())
 # }
# }
